Chrome DevTool Tips
In this article, I will write down some tips for more productive Chrome developer tools usage. Tips are grouped according to the tabs of Chrome DevTools.
Elements

You can add a breakpoint to DOM elements by clicking the 3 dots (…) on the left of elements panel lines. If you select the “Break on” option you will see 3 kinds of breakpoints. These are:
- subtree modification: Stop if any child elements changed.
- attribute modifications: Stop if any attribute of the element is changed.
- node removal: Stop if the element is removed from DOM.
Console
In this part, I will mention some helpful commands you can use in the Console panel of Chrome DevTool.
Firstly, there is an easy way to get selected elements in Console.$0: Returns the element which is currently selected in the Elements tab.$1: Returns the element which is previously selected in the Elements tab.$2: Returns the element which is twice previously selected in the Elements tab. So on and so forth.
Secondly, there are built-in selectors in DevTool which quite similar to JQuery.$(<css selector>): Returns the first matching element. Such as document.querySelector()
Ex: $('div.head'): select the first div element which has “head” class.
$$(<css selector>): Returns all matching elements. Such as document.querySelectorAll()
Ex: $('div.head'): select all div elements which have 'head' class.
Also, you can find an element in the Elements tab by using Console.inspect(<selector>): Select the element in Elements tab.
Ex: inspect($('div')): Selects the first div element in Elements tab.
Another helpful command is for monitoring events in Console.monitorEvents(selector, event): Write event objects to Console when the defined event is triggered for the selected element.
Ex: monitorEvents($(‘button’), ‘click’): Write event object to console while the selected button is clicked.
unmonitorEvents(<selector>): Remove event monitoring for the selected element.
Ex: unmonitorEvents($(‘button’)): Remove event logging for the selected button element.
Source

You can add snippets by selecting “Snippets” tab from the left panel in the Source tab. It is a helpful tool for debugging & testing. You can run these snippets by right click & “Run” or “Cmd + Enter” shortcut.

XHR breakpoints can be added for any requests or URL filtered ones. In the screenshot above XHR breakpoint added for the requests which contain “age” in its URL. So the DevTool stops whenever these type of request is sent.

Lastly, you can add conditional breakpoints by right-clicking the breakpoint and selecting “Edit breakpoint” from the menu.
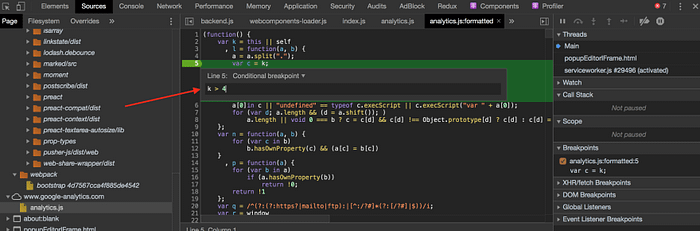
It stops only the entered condition is satisfied. For the screenshot above, it only stops if k is bigger than 4.
Network
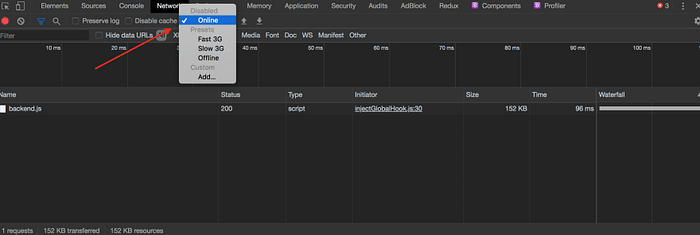
You can adjust your internet speed by changing “Throttling” setting under the Network tab. So, you can simulate slower connections for testing specific cases. It is very beneficial when you trying to handle loading states etc.
My some other articles: